Category: Task Management

  • Testing Agile PM in Data Science

    Testing Agile PM in Data Science

    For a number of years, I have been managing a small team of data analysts and engineers with a mandate to inform on innovation economy activity in Canada. Data that we work with involves surveys, data vendors and publicly available data sources, all within a ‘data partnership’ model.

    While our team was generally doing good work and providing critical analysis, a few years ago we ran into some issues. Challenges that would come up regularly:

    • Missed deadlines due to difficulty estimating how long tasks would take.
    • After publication, occasionally going back and revise results more than we would like.
    • In the background, there was sometimes a feeling of not quite hitting the mark in regards to delivering a high level of business value.

    These sound like classic project management problems and for that we turned to project management solutions. This included the adoption of Agile. We added Kanban and Scrum into the mix, with daily stand-ups to identify blocks and relay progress.

    Keep in mind, we are not a software development shop, we are a data science and analytics team. So, we were not exactly the perfect example of where these techniques have really been refined. Regardless, we met with some success and managed to improve our processes. However, we also discovered parts of our process where Agile plugs neatly in to our data pipeline, and other places where it was less of a ‘fit’.

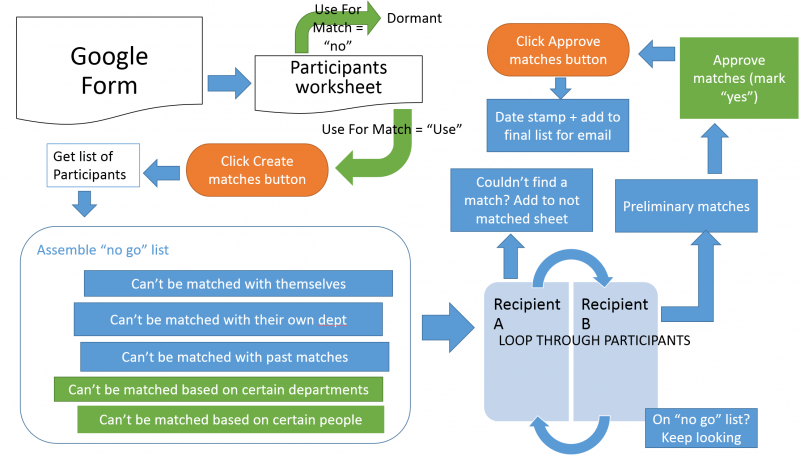
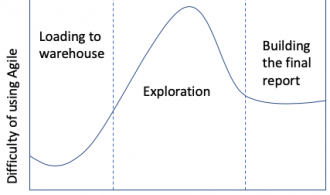
    In the diagram below, you can see the relationship to using Agile techniques to data analysis. This diagram is conceptual and based off my own anecdotal experience, but I think it outlines the concept nicely.

    Graph showing difficulty of adopting agile by data pipeline stage
    Level of difficulty of Agile adoption over the life of a data science project

    For showing our data pipeline, I highlighted three main sections: The first being getting and loading the data. Most of the data cleaning sits here. The second section is data exploration and most of the analysis. The final section, there is the final report and visuals.

    Of course, this is pretty simplistic and doesn’t consider scenarios like going back to the beginning if certain questions that we expected to answer cannot be answered. Also, I wouldn’t misconstrue these sections as “easy” and “hard” in and of themselves, but rather that some are more appropriate to Agile adoption than others.

    To summarize the concept, the biggest stumbling block to data exploration are the following:

    • Time estimates are the hardest to nail down when you are exploring the data. This is because you cannot always tell what you are going to find, and can potentially run into a number of roadblocks if the story does not emerge.
    • Furthermore, if your primary stakeholder is not a data person, he or she will struggle to provide feedback at this stage of the game.

    This is in contrast to the first section: loading data, while having some surprises, is often easier to estimate and a clearer ‘definition of done’ than the second section.

    The final section, writing the report, it gets easier again. This is because the report can be broken out into sections, each section can be treated like a user story and be road test according to Agile techniques more easily. Also, getting report sections in front of a stakeholder is easier for this person or people to wrap their heads around.

    Where did we land in the end? It depends on the stage and the type of project (not all of them are reports) but mostly we endeavor to follow an ‘Agile mindset’ and apply parts of it where it makes sense. We definitely feel positive about it and do not regret applying these techniques to our workflow.

  • Faking a Graph Structure with Google Sheets

    Faking a Graph Structure with Google Sheets

    I was asked recently to help our Social Committee with a problem: They arrange coffee meetups between employees at MaRS Discovery District, which is manageable with a short list where they know pretty much everyone. They are looking at expanding these meetups to (possibly) include an order of magnitude more participants. But this becomes a list management problem, as they need to figure out a way for these participants to be paired in a way that the list manager doesn’t tear her hair out every month going crazy with a list of participants hundreds of people long.

    Enter the graph database! Or not. I’ve played around with Neo4j in the past, and as cool as it is, I didn’t have a bandwidth to maintain a Neo4j database on top of everything else. Also, the group in question is very comfortable with Google Spreadsheets and has a Google Form plugged into their current list.

    When building out a solution that I don’t want to have to go back and keep revisiting, I do a couple of things: build it using a technology that is common enough that the client could hunt down a solution (or find someone else fairly easily) and use something that client is already comfortable with.

    Basically, an interested participant would fill out a Google Form to populate a spreadsheet. A screen capture of the form is below. Screen capture of google formOnce a list of interested participants was built up, there should be a ‘one click’ pairing of matches and then another ‘click’ to move approved matches to the final list. There was some ‘common sense’ logic that needed to be built in, that would be obvious to a human, but less obvious to an algorithm without being explicit:

    1. the participant can’t be paired with themselves
    2. since this is about meeting new people, they can’t be paired with someone from their own department, or organization, if the company is small enough
    3. they can’t be paired with someone they have already been paired with
    4. maybe there is some organization and/or department they already closely work with, so we should avoid pairing with those
    5. you also want to be able to deactivate (and possibly reactivate) a participant for whatever reason
    6. as alluded to, above, the list manager wants to be able to eyeball the list of potential matches
    7. date stamp automatically

    My solution meant a script entailed creating a ‘no-go’ list using Google Scripts embedded in the Google Sheet and then looping through potential matches until it finds someone that can be matched (e.g. is NOT on the ‘no-go’ list). It’s sort of a negative option approach and, yeah, if there were thousands of names and this had to be done in real time, for sure another solution would be better. In this case, because this script can take a few minutes to run and we’re looking at a few hundred names, maximum, then this solution fits the current scope. (Also, given this is a ‘side of the desk’ in-my-spare-time favor-for-a-friend kind of job, this should work).

    Logic and workflow displayed visually, below:

    Serendipity workflow

    As for the logic itself, it works pretty well. One small hiccup it that it doesn’t optimize matches, but rather locks in the first match it finds. So the last two participants may get ‘shut out’ even though there is a match out there, for them, somewhere. A graph database would be less likely to do this, but in the short term, this can be tweaked manually by the list manager, who still comes out ahead given the alternative of plowing through hundreds of names manually, cleaning up one or two at the end isn’t so bad.

    You can see the result in the Google Spreadsheet here. Or if the link is broken, here is a screen capture of the first sheet, with the button controls (basically two images which trigger the scripts).
    Serendipity controls

  • How I Manage oDesk Jobs

    How I Manage oDesk Jobs

    I’ve been introduced to a world of freelance developers in a whole new way via a website called oDesk. In it, you can either be a freelancer and search out contract jobs which match your skills, or post a job, big or small, for developers and freelancers to bid on. Because it is not tied down to a geographic location, it is a great opportunity to expand your pool of potential candidates (or jobs) worldwide.

    I’ve been actively using it for a few months and some days at work, it can take up most of my day. I also decided to use it to move ahead with the Cleeve Horne website: It was a site I had starting building but it was a big enough task that I got 90% of the way there and burned myself out on it. It’s hard to create quality work while sitting on a TTC bus riding to work.

    So it sat for a few months, eating away at me that I wasn’t going to get it done. Finally, I started breaking off pieces of what was left and gave it to some “oDeskers”. It’s not done, but as long as I can get some intrepid contractors to bravely traverse my spaghetti code, I can see the end in sight.

    From this I have a few tips for effectively managing your oDeskers. Some obvious, some not so much.

    Patience
    You’ll be dealing with contractors who may have a different mother tongue and have to figure out possibly fairly complicated stuff based on your instructions. Make things as easy as possible for them by explaining very clearly (ideally with screen captures or other examples) of what you need. Be kindly persistent if they don’t seem to be getting it right away.

    Get on DropBox (or Box.com), Skype, Team Viewer
    Since your contractors will be working remotely (sometimes very remotely, think overseas) you want basically a virtual communication and sharing arsenal that you can trade documents and coordinate. Team Viewer is useful if some kind of troubleshooting actually has to be done in your environment and you don’t want them to have your passwords.

    Close when done
    For a time, you may give your contractors access to your DropBox, or even password-related stuff (avoid the latter if you can). Do yourself a favour and close off their access when they are done the job, just to tie up loose ends.

    Find your ‘diamonds in the rough’
    The default, especially when starting out to hire, is to engage someone who has 1000+ oDesk hours and at least a 4.5 star rating. That’s a good strategy, but they are hot and priced accordingly. Alternately, you can track down hidden gems who are new to oDesk. They will be cheaper because they are just breaking in, and they will be eager to please to get some good ratings right at the outset. You can usually spot them by a strong portfolio and a believably strong C.V. Keep an eye out for bidders who fit that profile because people like that can really pay off. I recently found one for some SQL server work and he completely ninja-ed it faster than the other developers I had working in parallel to him.

    Happy oDesking!