Blog

  • Bluetooth RGB lights using ESP32

    Car lights talking to each other via bluetooth

    Some time ago, one of my kids came home with a couple of discarded truck lights they’d found. They’re the kind that go on the rear of a vehicle, with space for three bulbs each. They were in surprisingly good shape, so we started wondering: what if we put multicolour lights inside them and turned them into something new?


    Before I got too far, I was given a short list of requirements. The lights needed to hang on the wall. They needed to talk to each other wirelessly. They had to show multiple colours. And, finally, could they run on batteries so we wouldn’t have cables dangling everywhere? No pressure.


    Saying I went down a few dead ends would be putting it mildly. My first attempt involved a separate remote control and Arduino WiFi MKR 1010 boards, but I quickly ran into trouble. The boards were finicky about staying connected to Wi-Fi, performance was inconsistent, and the whole setup felt more complicated than it needed to be. Eventually, I switched to ESP32 boards using Bluetooth and moved the controls directly into one of the lights instead of a separate controller. The ESP32s just worked. In hindsight, if I’d started there, I probably could have avoided a lot of detours.


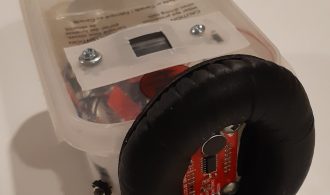
    Of course, car lights aren’t exactly designed to hold a collection of hobbyist electronics. To make everything fit, I ended up 3D-printing several small boxes and covers, attaching them with bolts or Velcro. I deliberately avoided drilling new holes in the original lights, just in case we ever wanted to take the whole thing apart and sell them later.

    Electronic components

    • Common anode RGB LED – There was no reason for using a common anode LED, it wasn’t specified on the Amazon order and it works just as well.
    • ESP32 – as I mentioned earlier, I had tried an Arduino WIFI MKR 1010. As well, I had also tried a Raspberry Pi Pico and I found the ESP32 were more stable and “just worked” for what I needed. I’ll probably use both the Arduino and the Pico for other projects, instead.
    • Buck converter maybe this is overkill but I could pair this with more batteries and get good-enough voltage control.
    • Slide switches – potentiometers would have been more fine-grained, but switches are fine fairly straightforward.
    • Diode – I use this in case I am plugging in my ESP32 to change the code and don’t feel like unplugging the main power. It just does its job, which is to keep the current flowing in the right direction.

    Circuit Diagrams

    I have two diagrams, one is the “sender” of the signal and has three slide switches. The switches turn the colours one and off. The other is the bluetooth “receiver” which does not have any switches but is otherwise the same.

    Wiring diagram of the sender.

    For the 9V battery, I used 6 AA batteries. I really wanted to ensure all the electronics were powered, properly and brought the voltage down using the buck converter.

    Wiring diagram of the receiver. It is mostly the same except there are no slide switches.
    Wiring of receiver module.

    3D printed components

    The prints aren’t complicated, where the only thing that took any special calculation was a little trigonometry to get some of the angles for the back correct. Getting to use that was nice because I had just been tutoring my oldest in math and now I was able to use it in a “real world” situation. 

    The stl files can be reached via this link on Google Drive https://drive.google.com/file/d/1Uyve7hnl4fjpOUiTSy3FAjQ02FXD4fiL/view?usp=sharing

    Back of lights 3D printed. The square hole is for hanging on the wall.

    Code

    This is the code for the ESP32 that sends commands to the receiving module. Full disclosure is ChatGPT helped troubleshoot this when I got stuck.

    #include <BLEDevice.h>
    #include <BLEUtils.h>
    #include <BLEScan.h>
    #include <BLEClient.h>
    #include <BLERemoteService.h>
    #include <BLERemoteCharacteristic.h>
    #include <Arduino.h>
    #include "driver/ledc.h"
    #include <string>
    
    ///----set the switches
    #define bluePin 4
    #define greenPin 16
    #define redPin 15
    int redState;
    int blueState;
    int greenState;
    
    //------set the LED pins
    const int ledPin1 = 17; //red
    const int ledPin2 = 23; //green
    const int ledPin3 = 22; //blue
    const int ledChannel1 = 0;
    const int ledChannel2 = 1;
    const int ledChannel3 = 2;
    const int freq = 5000;
    const int resolution = 8;
    
    //-------set calculated variables
    int rset;
    int bset;
    int gset;
    
    static BLEAddress *pServerAddress;  // Peripheral BLE address
    static boolean doConnect = false;
    static boolean connected = false;
    static BLERemoteCharacteristic* pRemoteCharacteristic;
    ///the following is for the button
    String sendthing = "1";
    int buttonState = 0;   
    ///end of button thing
    #define SERVICE_UUID        "12345678-1234-1234-1234-1234567890ab"  // Replace with your service UUID
    #define CHARACTERISTIC_UUID "abcdefab-1234-5678-1234-abcdefabcdef"  // Replace with your characteristic UUID
    
    // Callback to handle discovered peripherals during scan
    class MyAdvertisedDeviceCallbacks: public BLEAdvertisedDeviceCallbacks {
        void onResult(BLEAdvertisedDevice advertisedDevice) {
            Serial.print("Found device: ");
            Serial.println(advertisedDevice.toString().c_str());
    
            // If device has the service UUID we want
            if (advertisedDevice.haveServiceUUID() && advertisedDevice.isAdvertisingService(BLEUUID(SERVICE_UUID))) {
                advertisedDevice.getScan()->stop();  // stop scanning
                pServerAddress = new BLEAddress(advertisedDevice.getAddress());
                doConnect = true;                     // flag to connect in loop
                Serial.println("Found target device! Will connect...");
            }
        }
    };
    
    // Connect to peripheral and discover service/characteristic
    bool connectToServer(BLEAddress pAddress) {
        Serial.print("Connecting to ");
        Serial.println(pAddress.toString().c_str());
    
        BLEClient*  pClient  = BLEDevice::createClient();
        Serial.println(" - Created client");
    
        if (!pClient->connect(pAddress)) {
            Serial.println("Failed to connect.");
            return false;
        }
        Serial.println(" - Connected to server");
    
        BLERemoteService* pRemoteService = pClient->getService(SERVICE_UUID);
        if (pRemoteService == nullptr) {
            Serial.println("Failed to find service.");
            pClient->disconnect();
            return false;
        }
        Serial.println(" - Found service");
    
        pRemoteCharacteristic = pRemoteService->getCharacteristic(CHARACTERISTIC_UUID);
        if (pRemoteCharacteristic == nullptr) {
            Serial.println("Failed to find characteristic.");
            pClient->disconnect();
            return false;
        }
        Serial.println(" - Found characteristic");
    
        connected = true;
        return true;
    }
    
    void setup() {
        Serial.begin(115200);
        Serial.print("sending[0] is :");
        Serial.println(sendthing[0]);
      //----these are the on-off switches
      pinMode(redPin, INPUT_PULLUP);
      pinMode(bluePin, INPUT_PULLUP);
      pinMode(greenPin, INPUT_PULLUP);
    
      // Set up PWM channels
      ledcSetup(ledChannel1, freq, resolution);
      ledcSetup(ledChannel2, freq, resolution);
      ledcSetup(ledChannel3, freq, resolution);
    
      // Attach LED pins
      ledcAttachPin(ledPin1, ledChannel1);
      ledcAttachPin(ledPin2, ledChannel2);
      ledcAttachPin(ledPin3, ledChannel3);
    
      // Force the duty to zero - the LEDs are Anode, meaning the 'high' is 'low'
      ledcWrite(ledChannel1, 255);
      ledcWrite(ledChannel2, 255);
      ledcWrite(ledChannel3, 255);
        
        Serial.println("Starting ESP32 BLE Client...");
    
        BLEDevice::init("ESP32_Client");
    
        BLEScan* pBLEScan = BLEDevice::getScan();
        pBLEScan->setAdvertisedDeviceCallbacks(new MyAdvertisedDeviceCallbacks());
        pBLEScan->setActiveScan(true);
        pBLEScan->start(10, false); // scan for 10 seconds
    }
    
    void loop() {
        if (doConnect) {
            if (connectToServer(*pServerAddress)) {
                Serial.println("We are now connected to the BLE Server.");
            } else {
                Serial.println("Failed to connect to server.");
            }
            doConnect = false;
        }
    
        if (connected) {
            if (pRemoteCharacteristic->canRead()) {
              //  String value = pRemoteCharacteristic->readValue();  // Arduino String
                String value = String(pRemoteCharacteristic->readValue().c_str()); // correct for ESP32 BLE Arduino
        Serial.print("Characteristic value: ");
        Serial.println(value.c_str());  // can print Arduino String directly
            }
    
            // Example: write a value
            if (pRemoteCharacteristic->canWrite()) {
                pRemoteCharacteristic->writeValue(sendthing[0]);
                Serial.print("I sent ");
                Serial.println(sendthing[0]);
            }
    
            delay(300);  // wait 0.5 seconds before next read/write
        }
        // put your main code here, to run repeatedly:
      redState = digitalRead(redPin);
      blueState = digitalRead(bluePin);
      greenState = digitalRead(greenPin);
      Serial.print("Red state is: ");
      Serial.print(redState);
      Serial.print(" and Blue state is: ");
      Serial.print(blueState);
      Serial.print(" and Green state is: ");
      Serial.print(greenState);
      Serial.print(" and the sendthing is: ");
      Serial.println(sendthing);
      //all the different possiblities
      if(redState == LOW && greenState == LOW && blueState == LOW){
        sendthing = "1";
      }
      else if(redState == HIGH && greenState == LOW && blueState == LOW){
        sendthing = "2"; //red
      }
      else if(redState == HIGH && greenState == HIGH && blueState == LOW){
        sendthing = "3"; 
      }
      else if(redState == HIGH && greenState == HIGH && blueState == HIGH){
        sendthing = "4";
      }
      else if(redState == LOW && greenState == HIGH && blueState == HIGH){
        sendthing = "5";
      }
      else if(redState == LOW && greenState == LOW && blueState == HIGH){
        sendthing = "6";
      }
      else if(redState == HIGH && greenState == LOW && blueState == HIGH){
        sendthing = "7";
      }
      else if(redState == LOW && greenState == HIGH && blueState == LOW){
        sendthing = "8";
      }
        for (int duty = 0; duty <= 255; duty++) {
          redState == LOW ? rset = 255 : rset = duty ;
          greenState == LOW ? gset = 255 : gset = duty ;
          blueState == LOW ? bset = 255 : bset = duty ;
          ledcWrite(ledChannel1, rset);
          ledcWrite(ledChannel2, gset);
          ledcWrite(ledChannel3, bset);
          delay(30);
        }
      for (int duty = 255; duty >= 0; duty--) {
          redState == LOW ? rset = 255 : rset = duty ;
          greenState == LOW ? gset = 255 : gset = duty ;
          blueState == LOW ? bset = 255 : bset = duty ;
          ledcWrite(ledChannel1, rset);
          ledcWrite(ledChannel2, gset);
          ledcWrite(ledChannel3, bset);
          delay(30);
        }
    }

    The following is the receiver code on the module with no switches.

    #include <BLEDevice.h>
    #include <BLEServer.h>
    #include <BLEUtils.h>
    #include <BLE2902.h>
    #include <string>
    #include <Arduino.h>
    #include "driver/ledc.h" 
    
    // UUIDs (use random unique ones if you want)
    #define SERVICE_UUID        "12345678-1234-1234-1234-1234567890ab"
    #define CHARACTERISTIC_UUID "abcdefab-1234-5678-1234-abcdefabcdef"
    
    //------set the LED pins
    const int ledPin1 = 22; //red
    const int ledPin2 = 23; //green
    const int ledPin3 = 17; //blue
    const int ledChannel1 = 0;
    const int ledChannel2 = 1;
    const int ledChannel3 = 2;
    const int freq = 5000;
    const int resolution = 8;
    int rset;
    int bset;
    int gset;
    String value;
    #define LED_1 4
    #define LED_2 5
    int theglobal = 4;
    int usethis = 4;
    BLECharacteristic *commandCharacteristic;
    
    class CommandCallback : public BLECharacteristicCallbacks {
      void onWrite(BLECharacteristic *pCharacteristic) {
        value = String(pCharacteristic->getValue().c_str()); // correct for ESP32 BLE Arduino
        Serial.print("the value is: ");
        Serial.println(value);
        if (value.length() > 0) {
          Serial.print("Received command: ");
         // Serial.println(value.c_str());
            Serial.println(value);
          // Example: turn LED on/off with "ON"/"OFF"
          if (value == "1") {
            // everything off
            rset = 255;
            gset = 255;
            bset = 255;
          } else if (value == "2") {
            // red
            rset = 1;
            gset = 255;
            bset = 255;
          
          } else if (value == "3") {
            // red and green
            rset = 1;
            gset = 1;
            bset = 255;
          
          } else if (value == "4") {
            // white
            rset = 1;
            gset = 1;
            bset = 1;
          
          } else if (value == "5") {
            // yellow
            rset = 255;
            gset = 1;
            bset = 1;
          
          } else if (value == "6") {
            // blue
            rset = 255;
            gset = 255;
            bset = 1;
          
          } else if (value == "7") {
            // purple
            rset = 1;
            gset = 255;
            bset = 1;
          
          } else if (value == "8") {
            // all gree
            rset = 255;
            gset = 1;
            bset = 255;
          }
          // Example: accept "R,G,B" (basic parse for PWM LED strip)
          else {
            /// not sure so just turn everyhing on
            rset = 1;
            gset = 1;
            bset = 1;
          }
        }
      }
    };
    
    void setup() {
      Serial.begin(115200);
        // Set up PWM channels
      ledcSetup(ledChannel1, freq, resolution);
      ledcSetup(ledChannel2, freq, resolution);
      ledcSetup(ledChannel3, freq, resolution);
    
      // Attach LED pins
      ledcAttachPin(ledPin1, ledChannel1);
      ledcAttachPin(ledPin2, ledChannel2);
      ledcAttachPin(ledPin3, ledChannel3);
    
      // Force the duty to zero - the LEDs are Anode, meaning the 'high' is 'low'
      ledcWrite(ledChannel1, 255);
      ledcWrite(ledChannel2, 255);
      ledcWrite(ledChannel3, 255);
    
      BLEDevice::init("ReceiverESP32");  // BLE device name
      BLEServer *pServer = BLEDevice::createServer();
    
      BLEService *pService = pServer->createService(SERVICE_UUID);
    
      commandCharacteristic = pService->createCharacteristic(
        CHARACTERISTIC_UUID,
        BLECharacteristic::PROPERTY_WRITE |
        BLECharacteristic::PROPERTY_READ
      );
    
      commandCharacteristic->setCallbacks(new CommandCallback());
      commandCharacteristic->setValue("Waiting...");
    
      pService->start();
    
      BLEAdvertising *pAdvertising = BLEDevice::getAdvertising();
      pAdvertising->addServiceUUID(SERVICE_UUID);
      BLEDevice::startAdvertising();
    
      Serial.println("Peripheral ready, advertising as 'ReceiverESP32'. With new code!");
    }
    
    void loop() {
        
            
            int rval;
            int bval;
            int gval;
            
        for (int duty = 0; duty <= 255; duty++) {
          rval = max(duty, rset) ;
          bval = max(duty, bset) ;
          gval = max(duty, gset) ;
          ledcWrite(ledChannel1, rval);
          ledcWrite(ledChannel2, gval);
          ledcWrite(ledChannel3, bval);
          Serial.print("the rval is :");
            Serial.print(rval);
            Serial.print(" and the gval is :");
            Serial.print(gval);
            Serial.print(" and the bval is :");
            Serial.print(bval);
            Serial.print(" and the duty is: ");
            Serial.println(duty);
          delay(30);
        }
        delay(30);
      for (int duty = 255; duty >= 0; duty--) {
          rval = max(duty, rset) ;
          bval = max(duty, bset) ;
          gval = max(duty, gset) ;
          ledcWrite(ledChannel1, rval);
          ledcWrite(ledChannel2, gval);
          ledcWrite(ledChannel3, bval);
          Serial.print("the rval is :");
            Serial.print(rval);
            Serial.print(" and the gval is :");
            Serial.print(gval);
            Serial.print(" and the bval is :");
            Serial.print(bval);
            Serial.print(" and the duty is: ");
            Serial.println(duty);
          delay(30);
        }
    }

  • Sound Detector with Microview

    Sound Detector with Microview

    I built this because our new home has a number of pinging ducts and I wanted to get to the bottom of it. So I decided to build something that could ‘hear’ through walls and display the number on a screen. In theory, this should allow me to pinpoint exactly where sounds might be located.

    I had a few components at my fingertips, one of them being the Sparkfun Microview which I might have even obtained way back when they had their Kickstarter campaign. I had built a pretty sweet magnet detector with them, so a sound detector should be relatively the same level of difficulty.

    Image of Sound Detector from top and side
    Sound Detector built with SparkFun components,

    I ordered the Sparkfun sound detector and hooked up all the components (the code below has some notes around that). Because reading the slider numbers were kind of tricky, I created a delay for displaying the current sound level. More useful is the “max” sound which shows quick peaks. In order to reset the maximum sound, I just installed a power button.

    /* Code from Sparkfun sound detector and Microview hookup guide
     * Connections:
     * The Sound Detector is connected to the Microview as follows:
     * (Sound Detector -> Arduino pin)
     * GND ? GND
     * VCC ? 5V
     * Gate ? Pin 1
     * Envelope ? A0
     * 
     * Additional library requirements: none, except Microview
     */
    #include <MicroView.h>
    MicroViewWidget *widget_max, *widget_snd; //declares a widget class which is the slider
    
    //sound variables
    int snd = 0; //this is the read of the sound
    int snd_max = 0; /// this is useful in case of fast, sudden ticks
    
    /// inputs to Microview
    #define PIN_ANALOG_IN A0
    #define PIN_GATE_IN 1 // different than sample code https://learn.sparkfun.com/tutorials/sound-detector-hookup-guide
    
    int counter = 0; ///use this to create a display in reading. why not use delay() function ? Because you want to update 'snd_max' as much as possible
    
    void setup()
    {
      Serial.begin(9600); // I only kept this for troubleshooting
      Serial.println("Initialized"); // again, not really needed
      uView.begin();
      uView.clear(PAGE);
      widget_snd = new MicroViewSlider(0,5,0,1024, WIDGETSTYLE1);//15, 0 is the location, 0, 255 is the slider number
      widget_max = new MicroViewSlider(0,30,0,1024, WIDGETSTYLE1+WIDGETNOVALUE);//50, 0 is the location, 0, 255 is the slider number
    // I have the WIDGETNOVALUE because I have special max text with labels (see further down)
    }
    
    void loop()
    {
      snd = analogRead(PIN_ANALOG_IN);
      counter++ ; ///once this gets up to a certain amount, then update the main slider viz
      Serial.println(counter);
      if(counter >= 90){
          widget_snd->setValue(snd);  //top slider
          counter = 0; // reset counter
      }
      // this next section sets the sound max (bottom) slider
      if(snd > snd_max){snd_max = snd;}
      widget_max->setValue(snd_max);
      // this next section is just to make sure what is max and what is not is visible
      uView.setCursor(10,40);
      char max_text[10];
      sprintf(max_text,"max: %d", snd_max);
      uView.print(max_text);
      uView.display();
      delay(10);
    }

    The assembly used a headphone cover in order to insulate against outside sounds and I could then hold it up against a wall/floor/ceiling. I didn’t have a nice project box that let me look inside, so I used an old plastic box that used to hold nails in it. The advantage is the plastic is soft enough to cut or drill easily and is the right size. It also felt pretty DIY punk rock.

    Image of top view of sound detector
    Sound Detector seen from the top

    Some minor headaches is that the Microview doesn’t have the pin numbers on it, probably for aesthetic reasons. So you keep having to refer to a diagram, which I printed up an posted on a wall. For troubleshooting, you have to disconnect the whole thing and then reconnect it. Because of that, I would say that Microview is great, but not the first hobby micro-controller you ever want to use. I think they are so cute and otherwise easy to use, though, that I feel like the challenges are worth it.

  • Monkey Tank

    Monkey Tank

    The best projects are ones where you manage to find everything on-hand and no waiting for deliveries or going out to get extra material. Thus is the case with Monkey Tank. My nine-year old has a small stuffed monkey (named, you guessed it: “Monkey”) and wanted to build a little remote control car for it. Kids being kids, she does not have a lot of patience and also aren’t giant perfectionists, so I wanted something quick but fun.

    At home, I had a Rover S Robot Chassis that I thought I could do something at the cottage with, plus other miscellaneous parts (joystick, Arduino Uno, motor shield), Since I source most of my parts from Creatron, that’s where you are seeing most of the links.

    The parts list is as follows:

    View of tank opened to show wiring
    Overview of tank

    Any other tutorial I have seen of the chassis has really messy wiring, so no apologies as I follow that grand tradition. I did, however label the connectors (RF for “right front”, LF for “left front, and so on).

    Close up of wiring in the tank

    Coming to the rescue is a Fritzing diagram of the clean circuit. I paired each side (e.g. the left side together on one output, the right side together on the other output).

    Fritzing clean circuit diagram

    I found a sparkly box that probably had costume jewelry in it at some point. I wanted most of the body and casing to just be out of cardboard to be easy to cut and customize.

    Joystick box opened showing simple wiring

    For the body, we had an old Cana Kit box from a Raspberry Pi delivery, which turns out it was just the right size.

    Assembled tank with Monkey and Rabbit

    Finally below is the simple code. Thanks to past contributors and documentation, this was a fun project!

        /* Ardumoto and Rover S chassis sketch
      by: Joseph Lalonde 
      website: https://zenbot.ca
      twitter: https://twitter.com/jpindi
      date: May 17, 2020
      license: Public domain. Please use, reuse, and modify this 
      sketch.
      
      Special thanks to:
      Jim Lindblom, originally created November 8, 2013
      
      Adapted to v20 hardware by: Marshall Taylor, March 31, 2017
     
     With ardumoto, do NOT use pins 12, 3, 13, 11 
     */
    
    int JoyHorz = A0;
    int JoyVert = A1;
    
    int JoyPosVert = 512;
    int JoyPosHorz = 512;
    // Clockwise and counter-clockwise definitions.
    // Depending on how you wired your motors, 
    // you may need to swap.
    
    #define FORWARD  0
    #define REVERSE 1
    
    // Motor definitions to make life easier:
    #define MOTOR_A 0
    #define MOTOR_B 1
    
    // Pin Assignments 
    #define DIRA 12 // Direction control for motor A
    #define PWMA 3 // PWM control (speed) for motor A
    #define DIRB 13 // Direction control for motor B
    #define PWMB 11 // PWM control (speed) for motor B
    
    char data[100];
    
    void setup()
    {
      Serial.begin(9600); //I had the output to serial for troubleshooting.
      setupArdumoto(); // Set all pins as outputs
      stopArdumoto(MOTOR_A); //set to zero to start off
      stopArdumoto(MOTOR_B);
    
    void loop()
    {
      JoyPosVert = analogRead(JoyVert);
      JoyPosHorz = analogRead(JoyHorz);
      if (JoyPosVert < 200 || JoyPosVert > 800){
        // this 200 and 800 I had to play with trial and error
        // to get the right amount.
      if (JoyPosVert < 200){
      // this is in REVERSE
        driveArdumoto(MOTOR_A, REVERSE, 255);
        driveArdumoto(MOTOR_B, REVERSE, 255);  
      }
      else if (JoyPosVert > 800) { 
      
        driveArdumoto(MOTOR_A, FORWARD, 255);
        driveArdumoto(MOTOR_B, FORWARD, 255);
        
      } // end of if JoyPosVert
      } else if (JoyPosVert > 300 || JoyPosVert < 900) {
       if (JoyPosHorz > 900) { ////turn right
      
        driveArdumoto(MOTOR_A, REVERSE, 75); ////topsy turvy world!
        driveArdumoto(MOTOR_B, REVERSE, 255);
      }
      else if (JoyPosHorz < 200) { ////turn left
      
        driveArdumoto(MOTOR_A, REVERSE, 255);
        driveArdumoto(MOTOR_B, REVERSE, 75);
      }
      else {  ///do nothing
        stopArdumoto(MOTOR_B);
        stopArdumoto(MOTOR_A);
      }
      }else {  ///do nothing
        stopArdumoto(MOTOR_B);
        stopArdumoto(MOTOR_A);
      }
      sprintf(data, "Vertical input is: %d and Horizontal input is %d;", JoyPosVert, JoyPosHorz);
      //sprintf(data, "Sensor value of A3 is: %d and mapped is %d", bright, br_map);
      Serial.println(data); 
    delay(100);
    } //end of void loop
    
    // driveArdumoto drives 'motor' in 'dir' direction at 'spd' speed
    void driveArdumoto(byte motor, byte dir, byte spd)
    {
      if (motor == MOTOR_A)
      {
        digitalWrite(DIRA, dir);
        analogWrite(PWMA, spd);
      }
      else if (motor == MOTOR_B)
      {
        digitalWrite(DIRB, dir);
        analogWrite(PWMB, spd);
      }  
    }
    
    // stopArdumoto makes a motor stop
    void stopArdumoto(byte motor)
    {
      driveArdumoto(motor, 0, 0);
    }
    
    // setupArdumoto  setup the Ardumoto Shield pins 
    // initialize all pins
    void setupArdumoto()
    {
      // All pins should be setup as outputs:
      pinMode(PWMA, OUTPUT);
      pinMode(PWMB, OUTPUT);
      pinMode(DIRA, OUTPUT);
      pinMode(DIRB, OUTPUT);
    
      // Initialize all pins as low:
      digitalWrite(PWMA, LOW);
      digitalWrite(PWMB, LOW);
      digitalWrite(DIRA, LOW);
      digitalWrite(DIRB, LOW);
    }
    
  • 3D Printing a Fan Case

    3D Printing a Fan Case

    After a recent move to north Etobicoke, I thought I would check out the local Toronto Public Library near my home. To my delight they have a digital innovation hub, meaning green screen studios, computers with animation and design software and 3D printers. At the same time I was setting up my electronics workshop (we are trying to call it my “lab” but the name isn’t sticking) and needed a better way of dealing with solder fumes. Maker 101 exercises in popular how-to books show you how to build a solder fan out of a computer fan and a few other parts.

    I wanted a way of adjusting the direction of the fan, and decided to add a 3D printed case that could be mounted on a flexible tripod since it would be about the same size as a camera and I already had a number of tripods sitting around the house. I picked up a fan at A-1 Electronic Parts which is an amazing treasure trove of random used electronics. Searching on Thingiverse, however, showed only plans for either the wrong size for what I bought, or were just not functional enough. So I designed my own in Tinkercad.

    Tinkercad: https://www.tinkercad.com/users/j9jVvc6gZa2-jpindi

    Thingiverse: https://www.thingiverse.com/jpindi/about

    Taking the attitude of “measure 3 times, design 2 times, print once” I built a purely functional case, and the Library uses Cura to send the print job to the printer. I included a spot to insert a nut to allow me to attach the tripod. Basically I printed a hole the right size and used good jeweler’s glue to keep the nut in place.

    Nut used for attaching tripod.

    I had an old Angry Birds toy that I took apart that held some of the connections for the fan, including the plug. It works well! I still wear a mask and protective eyewear just to make sure, but I see the fumes getting pulled into the carbon filter consistently well.

    It was kind of long, with multiple visits to the library because I wanted to make sure I got all the pieces printed correctly. Unfortunately, that meant a slightly different shade of blue mid-way through, but you don’t really notice and since this is kind of a workhorse, aesthetics are not that important. Glad to have something at the end of the day that just works!

    Lording over a wiring job, War of the Worlds style!
  • Animating simpleheat.js

    Animating simpleheat.js

    As a POC (proof-of-concept) for a presentation, I wanted to generate a heat map, similar to the kind you see for Toronto Raptors players and for other examples, such as for airline flights or overlays on physical world maps.

    Because I was presenting this in front of a fairly mixed audience, I did not want to make assumptions about how well they could make the mental ‘leap’ while I explain the narrative I had built for them. In other words, for each part of the story I was telling them, I wanted them to see the transition from one idea to another. Therefore, I decided to find a way to animate the heatmap to make the transition as smooth as possible.

    A great lightweight heatmap is simpleheat.js (demo) that I integrated into a wireframe in the form of a web page. I stripped my presentation down and posted it to GitHub here.

    Because this is just a concept, the data is not actually generated by the client; it was data that I created for this purpose (see my blog post on creating placeholder data). For the demo, there are actually several data sets.

    However, the beginning heatmap result and the final result at the end can be really different than one another. Therefore, if you just hit ‘load’ on the next set of data to re-populate the heat map, it will ‘jump’ and not be a smooth transition.

    To get a smooth transition, I implemented an animation concept called inbetweening which in this case loads all the states in between the beginning and the end of the two heatmaps. Because this was just a fast proof-of-concept, there is lots of room for code optimization to make an even smoother transition and error checking.

    The order of operations is the following:

    1. Bring in the first json dataset and populate heatmap.
    2. Load in the second json but don’t populate the heatmap, yet. Make sure they have the same xy coordinates and that those coordinates in the second json are in the same order as the first json. (This is assumed to be generated at source. I didn’t add a try-catch to the code.)
    3. Find the two coordinates that have the greatest difference in z-values. This means running through the list, loading the values into the array and performing Math.max on the array. (Note this is a different ‘maximum’ than ‘themax’ variable in the code.)
    4. The max value from the step above is the number of incremental changes.
    5. The function looptheloop() is called as many times as needed, as determined by the steps 3 and 4 above. This function looks at the difference of the z-values for each coordinate.
    6. If there is no difference in the z-value for a given set of coordinates, do nothing and ride out the loops until the end (see ‘Same value’ section below).
    7. If there is a difference in z-value for a given pair of coordinates, it updates the starting json by moving it gradually closer and closer to the target json (see ‘Different z-value’ section, below).
    8. In the code, you will see there is an incremental update to a value called ‘themax’, but this might not be needed in your case. I used it to avoid the predominance of too much red in one of the results I was seeing.
    9. Therefore, the starting json is updated and reloaded, step-by-step. Once the starting and target json are the same, the incremental refreshing of the heatmap stops.

    Same z-value for source and target?

    Different z-value? Change and re-load by increments.

    In developing this code, I had a look at some dataframe capabilities to avoid so many loops. However, because I wanted to get this out quickly, I did not finish exploring javascript dataframes. If the number of loops causes your animation to grind, then a dataframe would be highly suggested.

    Want a smoother animation? Simply make the increments to be fractions (right now the fractions are 1 at a time, but could be 0.5 or 0.25 as simpleheat can handle it). Then call looptheloop function more often.

  • Placeholder heatmap data

    Placeholder heatmap data

    I recently needed to create an interactive wireframe concept using a heatmap. This was for a presentation and I needed to walk the client through a particular story. As a result I needed just enough data to populate the heatmap but had to somehow create the data myself.

    Getting the right data wouldn’t be straightforward: The heatmap, using json, requires both an x-and-y coordinates, and then a third value to denote intensity of colour on it (I’m calling it z or z-value). Since this was a POC (proof-of-concept) I needed just enough for it to work, but didn’t want to over-engineer it.

    Even though the heatmap is about 750 by 500 pixels, you don’t need 500 rows and 750 columns in Excel to get it to work. In my example I had 30 rows and 47 columns, and then I just multiplied them to get them to reach across to the full range of pixels in the heat map. This is because the points are fuzzy and spread out and cover any gaps. You’ll see this in the Excel example for download, below.

    Since I was kind of hacking this out, I simply created a grid in Excel which had x-coordinates along the top, y-coordinates on the side, and then in the middle, the z-values. In order for me to see roughly what it would look like, I used conditional formatting in Excel to show colour values based on a scale.

    Below the Excel ‘heatmap’, I concatenated values in the format of the json file, multiplying the coordinates so it would fill in the whole canvas in html. Then I cut the ‘json’ file into somewhere the javascript would find it. Running the simpleheat.js code on the placeholder file was the final step.

    In case the explanation isn’t enough, I’ve made the Excel file available for download here.

  • Testing Agile PM in Data Science

    Testing Agile PM in Data Science

    For a number of years, I have been managing a small team of data analysts and engineers with a mandate to inform on innovation economy activity in Canada. Data that we work with involves surveys, data vendors and publicly available data sources, all within a ‘data partnership’ model.

    While our team was generally doing good work and providing critical analysis, a few years ago we ran into some issues. Challenges that would come up regularly:

    • Missed deadlines due to difficulty estimating how long tasks would take.
    • After publication, occasionally going back and revise results more than we would like.
    • In the background, there was sometimes a feeling of not quite hitting the mark in regards to delivering a high level of business value.

    These sound like classic project management problems and for that we turned to project management solutions. This included the adoption of Agile. We added Kanban and Scrum into the mix, with daily stand-ups to identify blocks and relay progress.

    Keep in mind, we are not a software development shop, we are a data science and analytics team. So, we were not exactly the perfect example of where these techniques have really been refined. Regardless, we met with some success and managed to improve our processes. However, we also discovered parts of our process where Agile plugs neatly in to our data pipeline, and other places where it was less of a ‘fit’.

    In the diagram below, you can see the relationship to using Agile techniques to data analysis. This diagram is conceptual and based off my own anecdotal experience, but I think it outlines the concept nicely.

    Graph showing difficulty of adopting agile by data pipeline stage
    Level of difficulty of Agile adoption over the life of a data science project

    For showing our data pipeline, I highlighted three main sections: The first being getting and loading the data. Most of the data cleaning sits here. The second section is data exploration and most of the analysis. The final section, there is the final report and visuals.

    Of course, this is pretty simplistic and doesn’t consider scenarios like going back to the beginning if certain questions that we expected to answer cannot be answered. Also, I wouldn’t misconstrue these sections as “easy” and “hard” in and of themselves, but rather that some are more appropriate to Agile adoption than others.

    To summarize the concept, the biggest stumbling block to data exploration are the following:

    • Time estimates are the hardest to nail down when you are exploring the data. This is because you cannot always tell what you are going to find, and can potentially run into a number of roadblocks if the story does not emerge.
    • Furthermore, if your primary stakeholder is not a data person, he or she will struggle to provide feedback at this stage of the game.

    This is in contrast to the first section: loading data, while having some surprises, is often easier to estimate and a clearer ‘definition of done’ than the second section.

    The final section, writing the report, it gets easier again. This is because the report can be broken out into sections, each section can be treated like a user story and be road test according to Agile techniques more easily. Also, getting report sections in front of a stakeholder is easier for this person or people to wrap their heads around.

    Where did we land in the end? It depends on the stage and the type of project (not all of them are reports) but mostly we endeavor to follow an ‘Agile mindset’ and apply parts of it where it makes sense. We definitely feel positive about it and do not regret applying these techniques to our workflow.

  • Exploring Etobicoke and Mississauga High Schools

    Since one of my children is getting close to middle school, that puts high school on the radar. As a result, we decided to narrow our search to high schools because it would probably get too complicated to also include elementary schools (in addition to all the other factors, such as proximity to transit, ambiance and so on).

    In an attempt to narrow down the number of neighbourhoods that we are considering we thought it best to look at schools. I know that there is the idea of fit, finding the best school for that child. However I thought it would be interesting to look at objective measures.

    Interestingly I found an open data set on Ontario open data This had not only addresses, but also their level (high school or elementary school) percentage of students identified as gifted, percentage of grade nine students achieving the provincial standard in mathematics, percentage of grade 10 that passed their OSSLT on their first attempt.

    There was also a bunch of other factors that I don’t care about, like percentage of students whose first language is not English (kids are in French school at the moment) and percentage of children who live in low-income households. Interestingly, these are all things that I’ve heard the Fraser institute factors in to their ranking. So I think what I found is an older version of a typical dataset that the Fraser institute works with.

    You can also download slightly older data from the Fraser institute, but getting the two datasets to link is a manual process, so it’s not feasible for the GTA. Plus the address data for the Fraser institute is limited to the city level (and in the case of “Toronto” is too big to be meaningful).

    So going with the more detailed and more interesting open government set, I chose factors that related to high school, based around academic performance. Preferably a French school, but potentially immersion as a second choice. Also, the west end of Toronto and Mississauga are on our short list, so the Tableau default view takes that into account.

    I needed to use jitter for geolocation because, unfortunately Tableau only goes with FSA for Canadian postal codes, so you lose precision. Also, some schools are pretty much the same address (École secondaire Toronto ouest and ESC Frère-André for example). There is a good tutorial on the Tableau support site.

    I also saw some weird stuff in the data: the percentage of gifted students at some schools are in excess of 30%, which seems really high (not represented in the viz). Things to dig into at a later time.

  • CBC is adopting Neo4j

    CBC is adopting Neo4j

    Probably one of the more popular meetups in the Toronto area is the Toronto Data Science Group which regularly boasts a few hundred members at its meetings. I usually don’t sign up quickly enough and have missed out because they are at capacity. Last week, they hosted a meetup at MaRS Discovery District and I managed to get a spot, which was doubly good because it was at my place of work and I could pop down to the auditorium without trekking outside in the cold.

    I’m really glad I managed to make it, because the meetup (hosted by Christopher Berry) consisted of a presentation by Richard Loa of CBC who was showing us a couple of different tools that CBC has adopted. One is to augment their web analytics with Neo4j, a popular graph database and also to present read-js a JavaScript library they have developed to better capture onFocus events than their other web analytics tools currently do.

    Most of this was right up my alley, as in a former life I got into web analytics somewhat, and in particular how broadcasters measure their audience capture. The Canada Media Fund (“CMF”) where I used to work as an analyst was trying their best at the time to figure out how to incorporate “new” media audience in with their reward system. This system, the “Broadcaster Envelope Program” was a major part of the algorithm of how funding was allocated. The CMF had to figure out not only web, but how all media properties were measured was a challenge. I became highly aware of the problems broadcasters face as their business model rapidly changes away from traditional television. While I’ve moved on, I’ve kept up a tangential interest in the media sector.

    The second chord this struck with me was the adoption of Neo4j: I’ve played around with the free version and it is pretty powerful. CBC’s reason for adopting it was that it allows for the ability to traverse a graph and get in deep with understanding the relationships between their customers and their preferences. After the presentation, I felt like they were doing it the right way, by letting their business needs and questions drive them to adopting a graph structure, and not jumping on just because it is a cool tool.

    An added bonus was the inclusion of one guy who actually taught a Neo4j workshop I attended. Whether by accident or design, it was good to see him there, as he weighed in on some of the harder Neo4j questions from audience members.

    Finally, another piece of news is that CBC has developed a JavaScript library that lets it do a more robust job of tracking online readership. They have also done this the right way by putting it on GitHub and inviting contributors to improve the code. I would encourage anyone with the skills and the interest to dive in.

    Want to see more? Here is the link to the slides or check out their next meetup.

  • Faking a Graph Structure with Google Sheets

    Faking a Graph Structure with Google Sheets

    I was asked recently to help our Social Committee with a problem: They arrange coffee meetups between employees at MaRS Discovery District, which is manageable with a short list where they know pretty much everyone. They are looking at expanding these meetups to (possibly) include an order of magnitude more participants. But this becomes a list management problem, as they need to figure out a way for these participants to be paired in a way that the list manager doesn’t tear her hair out every month going crazy with a list of participants hundreds of people long.

    Enter the graph database! Or not. I’ve played around with Neo4j in the past, and as cool as it is, I didn’t have a bandwidth to maintain a Neo4j database on top of everything else. Also, the group in question is very comfortable with Google Spreadsheets and has a Google Form plugged into their current list.

    When building out a solution that I don’t want to have to go back and keep revisiting, I do a couple of things: build it using a technology that is common enough that the client could hunt down a solution (or find someone else fairly easily) and use something that client is already comfortable with.

    Basically, an interested participant would fill out a Google Form to populate a spreadsheet. A screen capture of the form is below. Screen capture of google formOnce a list of interested participants was built up, there should be a ‘one click’ pairing of matches and then another ‘click’ to move approved matches to the final list. There was some ‘common sense’ logic that needed to be built in, that would be obvious to a human, but less obvious to an algorithm without being explicit:

    1. the participant can’t be paired with themselves
    2. since this is about meeting new people, they can’t be paired with someone from their own department, or organization, if the company is small enough
    3. they can’t be paired with someone they have already been paired with
    4. maybe there is some organization and/or department they already closely work with, so we should avoid pairing with those
    5. you also want to be able to deactivate (and possibly reactivate) a participant for whatever reason
    6. as alluded to, above, the list manager wants to be able to eyeball the list of potential matches
    7. date stamp automatically

    My solution meant a script entailed creating a ‘no-go’ list using Google Scripts embedded in the Google Sheet and then looping through potential matches until it finds someone that can be matched (e.g. is NOT on the ‘no-go’ list). It’s sort of a negative option approach and, yeah, if there were thousands of names and this had to be done in real time, for sure another solution would be better. In this case, because this script can take a few minutes to run and we’re looking at a few hundred names, maximum, then this solution fits the current scope. (Also, given this is a ‘side of the desk’ in-my-spare-time favor-for-a-friend kind of job, this should work).

    Logic and workflow displayed visually, below:

    Serendipity workflow

    As for the logic itself, it works pretty well. One small hiccup it that it doesn’t optimize matches, but rather locks in the first match it finds. So the last two participants may get ‘shut out’ even though there is a match out there, for them, somewhere. A graph database would be less likely to do this, but in the short term, this can be tweaked manually by the list manager, who still comes out ahead given the alternative of plowing through hundreds of names manually, cleaning up one or two at the end isn’t so bad.

    You can see the result in the Google Spreadsheet here. Or if the link is broken, here is a screen capture of the first sheet, with the button controls (basically two images which trigger the scripts).
    Serendipity controls